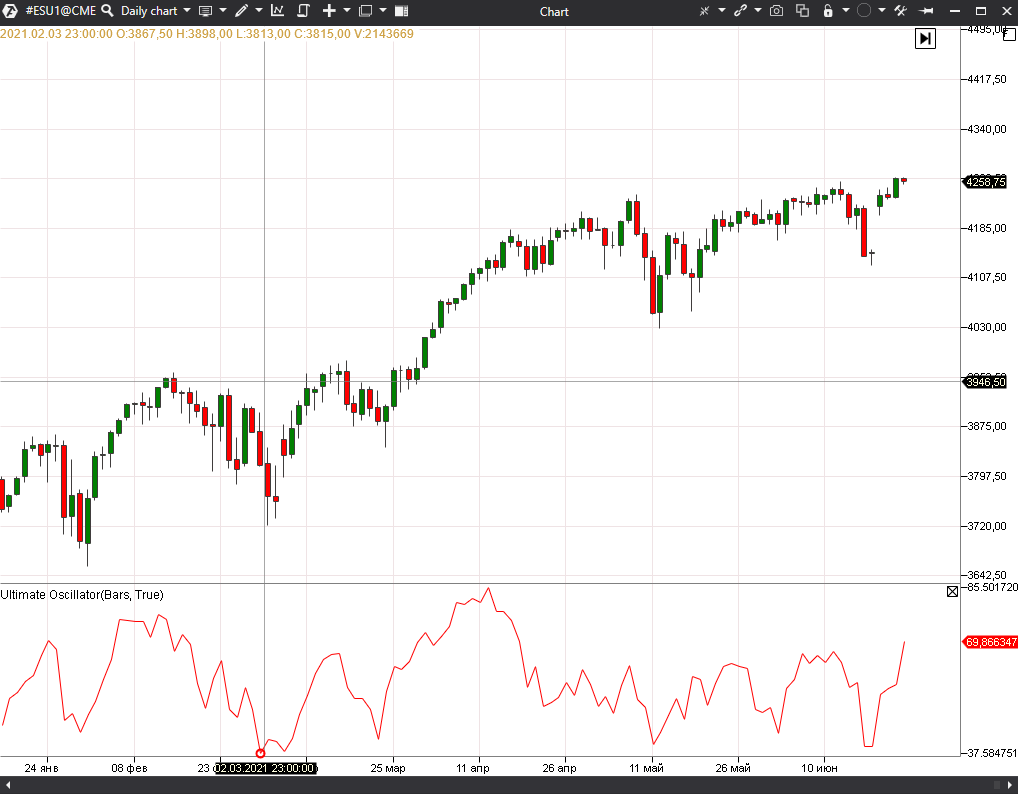
Ultimate Oscillator es un indicador técnico que fue desarrollado por Larry Williams en 1976 para medir el impulso del precio de un activo en múltiples marcos temporales. Utilizando una media ponderada de tres marcos temporales diferentes, el indicador tiene menos volatilidad y menos señales de negociación en comparación con otros osciladores que se basan en un solo marco temporal. Las señales de compra y venta se generan después de la divergencia. El oscilador Ultimate Oscillator genera menos señales de divergencia que otros osciladores debido a su estructura multitemporal.
Visualización del indicador en el gráfico.
The indicator has the following parameters:
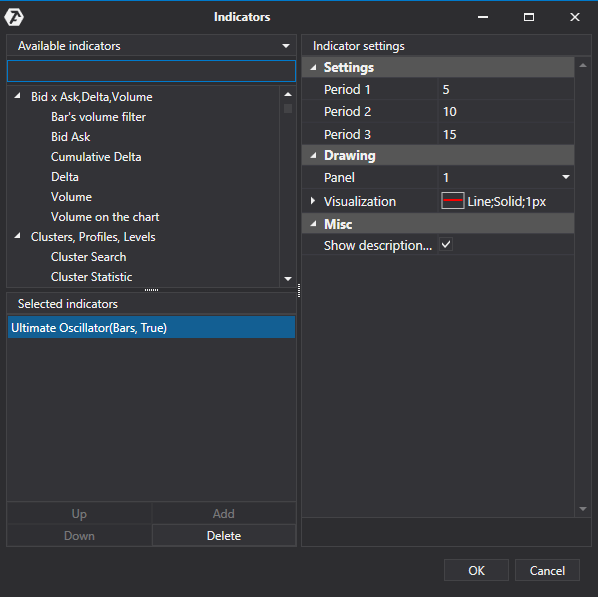
Settings/Ajustes
Period 1/Período 1 - ajuste del primer período de búsqueda de valores máximos.
Period 2/Período 2 - ajuste del segundo período de búsqueda de valores máximos.
Period 3/Período 3 - ajuste del tercer período de búsqueda de valores máximos.
Drawing
Panel/Panel - elección de la ubicación del indicador en el gráfico:
- New panel/Nuevo panel.
- Chart/Gráfico.
Visualization/Visualización
Show value/Mostrar valor actual - mostrar el valor del indicador en la escala de precios.
Show zero values/Mostrar valores cero - visualización de los valores cero.
Scale/Escalado automático - si esta opción está activada, el escalado se calculará automáticamente en base al valor mínimo y máximo del indicador, para que éste se ajuste al gráfico.
Color/Color
Visual type/Tipo - configuración visual del indicador visualizado en el gráfico:
- Line/Línea
- Histogram/Histograma
- Hash/Subrayado
- Block/Bloque
- Cross/Cruce
- Square/Cuadrado
- Dots/Punto
- Up arrow/Flecha arriba
- Down arrow/Flecha abajo
- Axis label/Inscripción en el eje
- Hide/Ocultar
Line style/Estilo de línea - configurar el modo de visualización de la línea:
- Dot/Punto
- Solid/Línea sólida
- Dash/Raya
- Dash - dot/Raya - punto
- Dash - dot - dot/Raya - punto - punto
Width/Anchura - ajuste de la anchura de la línea del indicador.
¿Le ha sido útil este artículo?
¡Qué bien!
Gracias por sus comentarios
¡Sentimos mucho no haber sido de ayuda!
Gracias por sus comentarios
Sus comentarios se han enviado
Agradecemos su esfuerzo e intentaremos corregir el artículo