NVI (Negative Volume Index) and PVI (Positive Volume Index) are technical indicators with a mirror-like calculation methodology, but with a similar interpretation, accumulating price changes for certain periods with, respectively, falling and growing trading volume relative to the previous period.
The volume index is equal to the cumulative sum of the current profit multiplied by the index value in the previous period at the moments when the current day s trading volume is less (or more) than the previous day s trading volume.
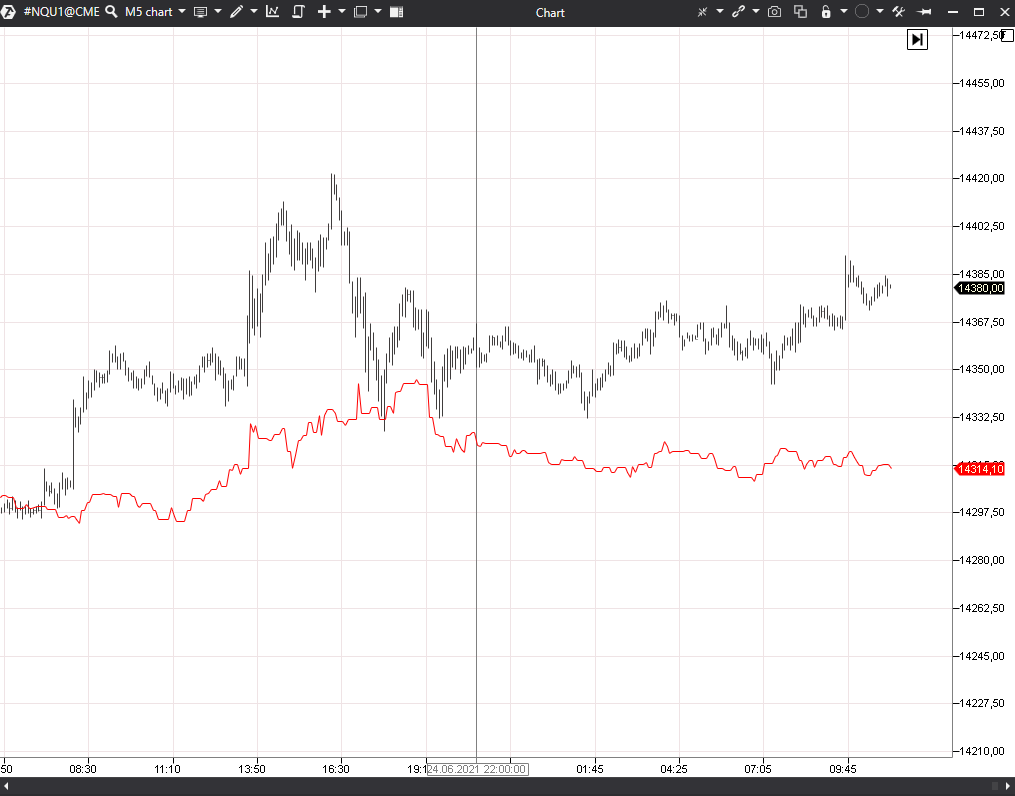
The indicator view in the chart.
The indicator has the following parameters:
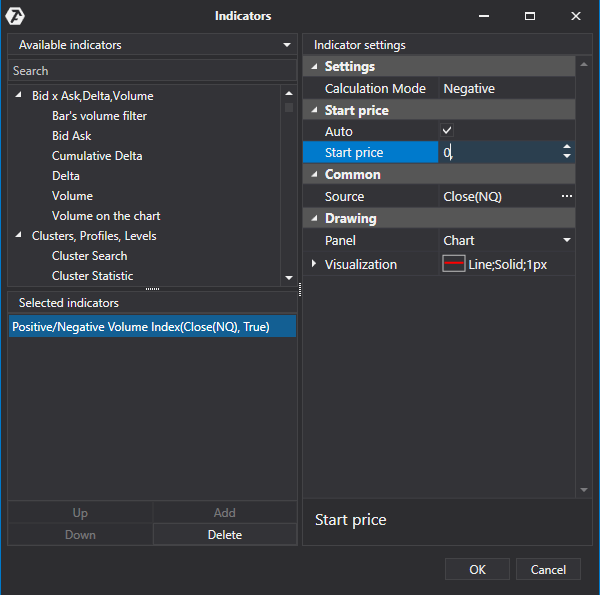
Settings
Calculation Mode - select the calculated index (positive or negative volume).
Start Price
Auto - enable automatic detection of the start price from which the index calculation will start.
Start Price - setting of the value of the start price from which the index calculation will start.
Common
Source - setting of the indicator calculation parameters:
- Open
- High
- Low
- Close
- Volume
Drawing
Panel - selection of the indicator location in the chart:
- New panel
- Chart
Visualization
Show value - display of the indicator value on the price scale on the left.
Scale/Auto-scaling - if this option is on, the scale will be automatically calculated, based on the minimum and maximum indicator values, so that the indicator would fit in the chart.
Color - color setting of the indicator.
Visual type - visual setting of the indicator display in the chart:
- Line
- Histogram
- Hash
- Block
- Cross
- Square
- Dots
- Up arrow
- Down arrow
- Axis label
- Hide
Line style - setting of the line display style:
- Solid
- Dash
- Dash - dot
- Dash - dot - dot
Width - setting of the indicator line width.
Was this article helpful?
That’s Great!
Thank you for your feedback
Sorry! We couldn't be helpful
Thank you for your feedback
Feedback sent
We appreciate your effort and will try to fix the article