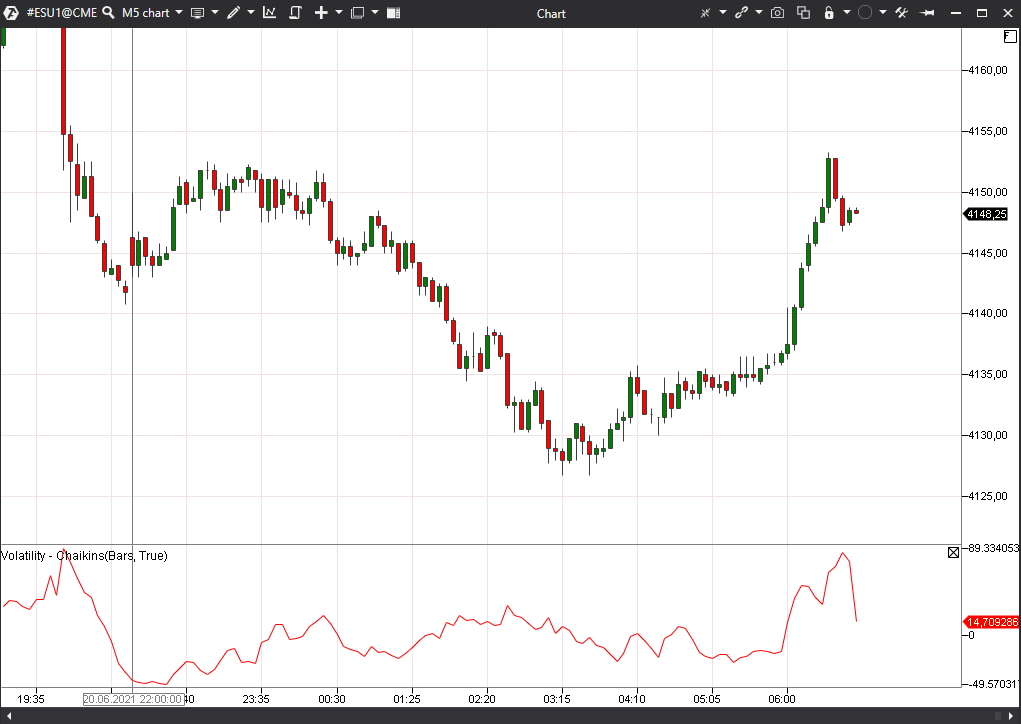
Chaikin Volatility is a simple and convenient indicator used to determine the market volatility. The instrument measures the difference between the maximum and minimum prices in a certain time range.
The indicator view in the chart.
The indicator has the following parameters:
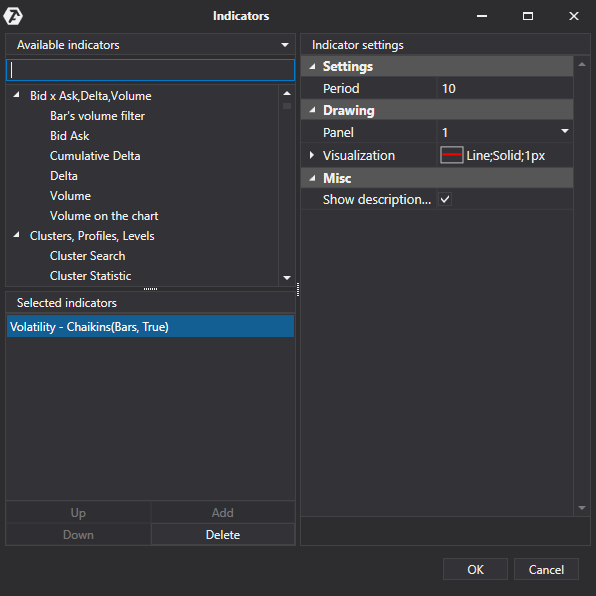
Settings
Period - setting of the indicator calculation period.
Drawing
Panel/Moving average period - selection of the indicator location in the chart:
- New panel
- Chart
Visualization
Show value - display of the indicator value on the price scale on the left.
Scale/Auto-scaling - if this option is on, the scale will be automatically calculated, based on the minimum and maximum indicator values, so that the indicator would fit in the chart.
Color - colour setting of the indicator.
Visual type - visual setting of the indicator display in the chart:
- Line
- Histogram
- Hash
- Block
- Cross
- Square
- Dots
- Up arrow
- Down arrow
- Axis label
- Hide
Line style - setting of the line display style:
- Solid
- Dash
- Dash - dot
- Dash - dot - dot
Width - setting of the indicator line width.
Was this article helpful?
That’s Great!
Thank you for your feedback
Sorry! We couldn't be helpful
Thank you for your feedback
Feedback sent
We appreciate your effort and will try to fix the article