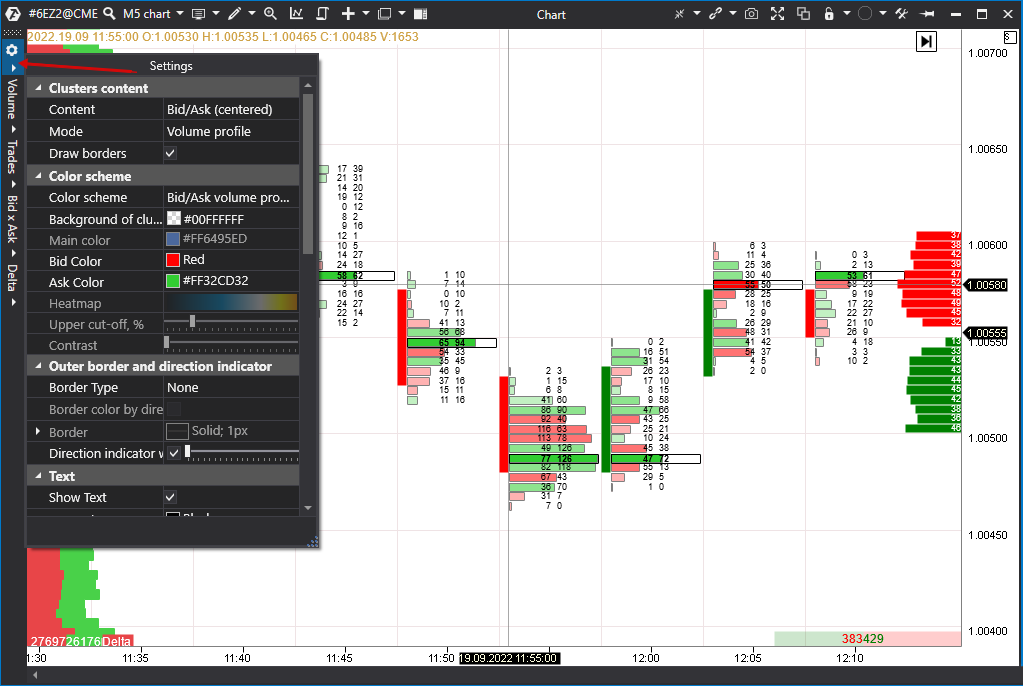
To open the settings, click on the icon on the chart menu bar, which will open a panel of visual settings on the left; select the second tab - Cluster Settings.
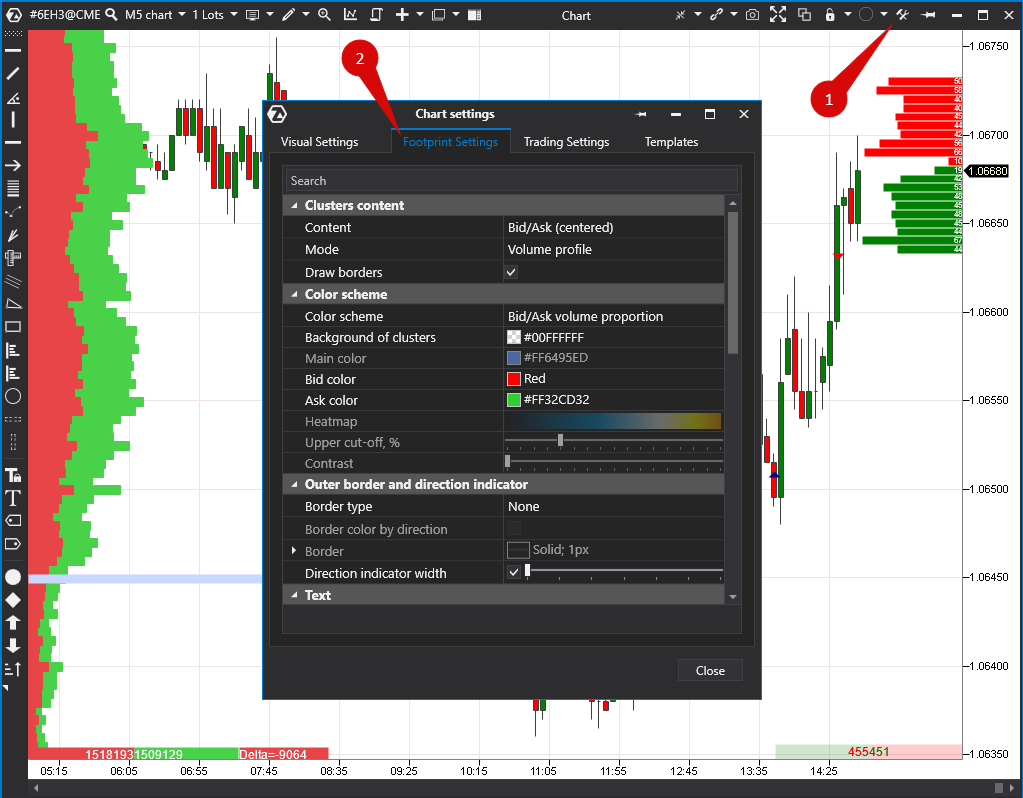
You can also open the settings menu from the side panel for choosing a cluster mode.
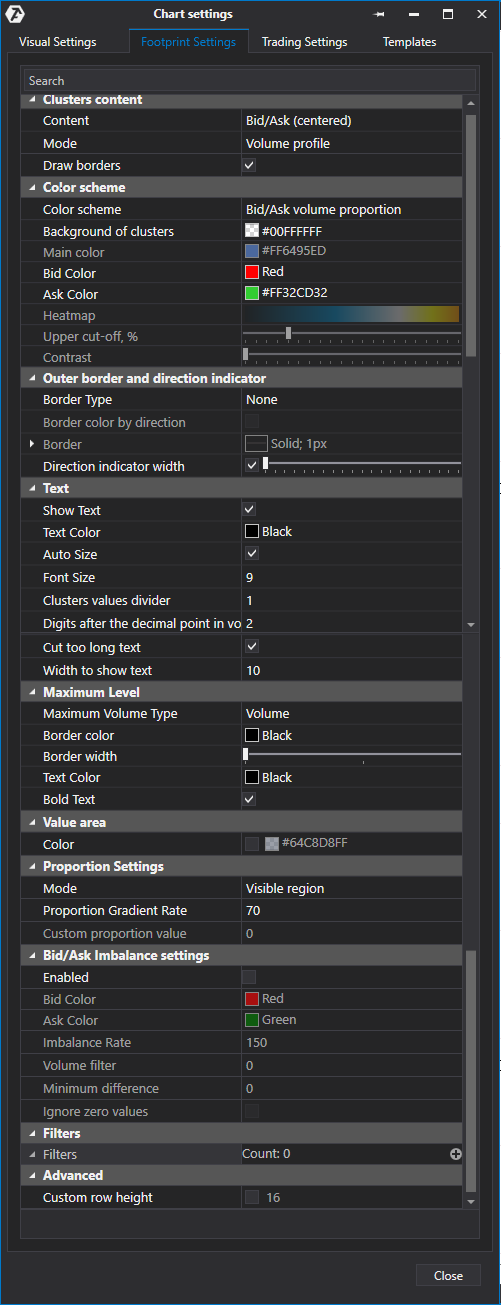
Clusters Settings
Search bar
Clusters content
Content:
- Volume
- Trades
- Volume and trades
- Volume and delta
- Delta
- Delta (centered)
- Bid x Ask
- Bid/Ask (centred)
- Bid/Ask
- None
Mode:
- Full row
- Bid/Ask profile
- Volume profile
- Trades profile
- Delta profile
- Bid/Ask ladder
- Positive/Negative delta profile
Draw borders
Color scheme
Color scheme:
- Delta
- Solid
- Volume proportion
- Trades proportion
- Bid/Ask volume proportion
- Heatmap by volume
- Heatmap by trades
- Heatmap by delta
- None
Background of clusters
Main color
Bid Color
Ask Color
Heatmap
Upper cut-off, %
Contrast
Outer border and direction indicator
Border Type - it has three settings:
- None
- Bod
- Candle
Border
- Color
- Line style
- Width
Border color by direction
Border:
- Color
- Line style
- Width
Direction indicator width
Font
Show Text
Text color
Auto Size
Font size
Cluster values divider
Cut too long text
Width to show text
Maximum Level Type
- Volume
- Trades
- Bid
- Ask
- Negative Delta
- Pozitive Delta
- Time
Border color
Text color
Bold text
Border width
Value Area
Show Value Area
Value Area Color
Proportion Settings.
Bars - the proportion is built relative to the largest value among the loaded bars.
- the color intensity of clusters relative to the largest value.
Visible area - the proportion is taken relative to the largest value in the visible area of the chart.
Whole chart - the proportion is built relative to the entire chart.
Custom proportion value - this option allows you to set the cluster value which is taken as 100 percent and the proportion will be built relative to it.
Bid/Ask Imbalance - it allows you to automatically highlight the imbalance of market buys and sells in each spread. Imbalance value is determined as a percentage of the compared volumes, details are here.
Filters.
Filter type - it has four options of settings:
- Bid
- Ask
- Volume
- Trades
- Relative volume, % of max.vol - this option allows you to set % of the maximum volume, clusters above it will be highlighted.
- Relative trades, % of max.trades - allows you to set the % of the maximum number of trades, clusters above it will be highlighted.
For example, Relative Volume is set to 90. This means that all clusters whose volume is higher than 90% of the maximum volume visible on the chart will be highlighted.
Value.
Text Color.
BackGround.
Advanced.
Custom row height.
Also read the following articles on this topic:
WHAT CAN THE CLUSTER CHARTS TELL YOU?
COMBINATION OF CLUSTER ANALYSIS, VOLUME LEVELS AND RANGE PLOTS
A PRACTICAL METHOD OF HOW TO DETECT A MAJOR PLAYER IN THE CLUSTER CHART
To open the settings, click on the icon on the chart menu bar, which will open a panel of visual settings on the left; select the second tab - Cluster Settings.
You can also open the settings menu from the side panel for choosing a cluster mode.
Clusters Settings
Search bar
Clusters content
Content:
- Volume
- Trades
- Volume and trades
- Volume and delta
- Delta
- Delta (centered)
- Bid x Ask
- Bid/Ask (centred)
- Bid/Ask
- None
Mode:
- Full row
- Bid/Ask profile
- Volume profile
- Trades profile
- Delta profile
- Bid/Ask ladder
- Positive/Negative delta profile
Draw borders
Color scheme
Color scheme:
- Delta
- Solid
- Volume proportion
- Trades proportion
- Bid/Ask volume proportion
- Heatmap by volume
- Heatmap by trades
- Heatmap by delta
- None
Background of clusters
Main color
Bid Color
Ask Color
Heatmap
Upper cut-off, %
Contrast
Outer border and direction indicator
Border Type - it has three settings:
- None
- Bod
- Candle
Border
- Color
- Line style
- Width
Border color by direction
Border:
- Color
- Line style
- Width
Direction indicator width
Font
Show Text
Text color
Auto Size
Font size
Cluster values divider
Cut too long text
Width to show text
Maximum Level Type
- Volume
- Trades
- Bid
- Ask
- Negative Delta
- Pozitive Delta
- Time
Border color
Text color
Bold text
Border width
Value Area
Show Value Area
Value Area Color
Proportion Settings.
Bars - the proportion is built relative to the largest value among the loaded bars.
- the color intensity of clusters relative to the largest value.
Visible area - the proportion is taken relative to the largest value in the visible area of the chart.
Whole chart - the proportion is built relative to the entire chart.
Custom proportion value - this option allows you to set the cluster value which is taken as 100 percent and the proportion will be built relative to it.
Bid/Ask Imbalance - it allows you to automatically highlight the imbalance of market buys and sells in each spread. Imbalance value is determined as a percentage of the compared volumes, details are here.
Filters.
Filter type - it has four options of settings:
- Bid
- Ask
- Volume
- Trades
- Relative volume, % of max.vol - this option allows you to set % of the maximum volume, clusters above it will be highlighted.
- Relative trades, % of max.trades - allows you to set the % of the maximum number of trades, clusters above it will be highlighted.
For example, Relative Volume is set to 90. This means that all clusters whose volume is higher than 90% of the maximum volume visible on the chart will be highlighted.
Value.
Text Color.
BackGround.
Advanced.
Custom row height.
Also read the following articles on this topic:
WHAT CAN THE CLUSTER CHARTS TELL YOU?
COMBINATION OF CLUSTER ANALYSIS, VOLUME LEVELS AND RANGE PLOTS
A PRACTICAL METHOD OF HOW TO DETECT A MAJOR PLAYER IN THE CLUSTER CHART
Was this article helpful?
That’s Great!
Thank you for your feedback
Sorry! We couldn't be helpful
Thank you for your feedback
Feedback sent
We appreciate your effort and will try to fix the article