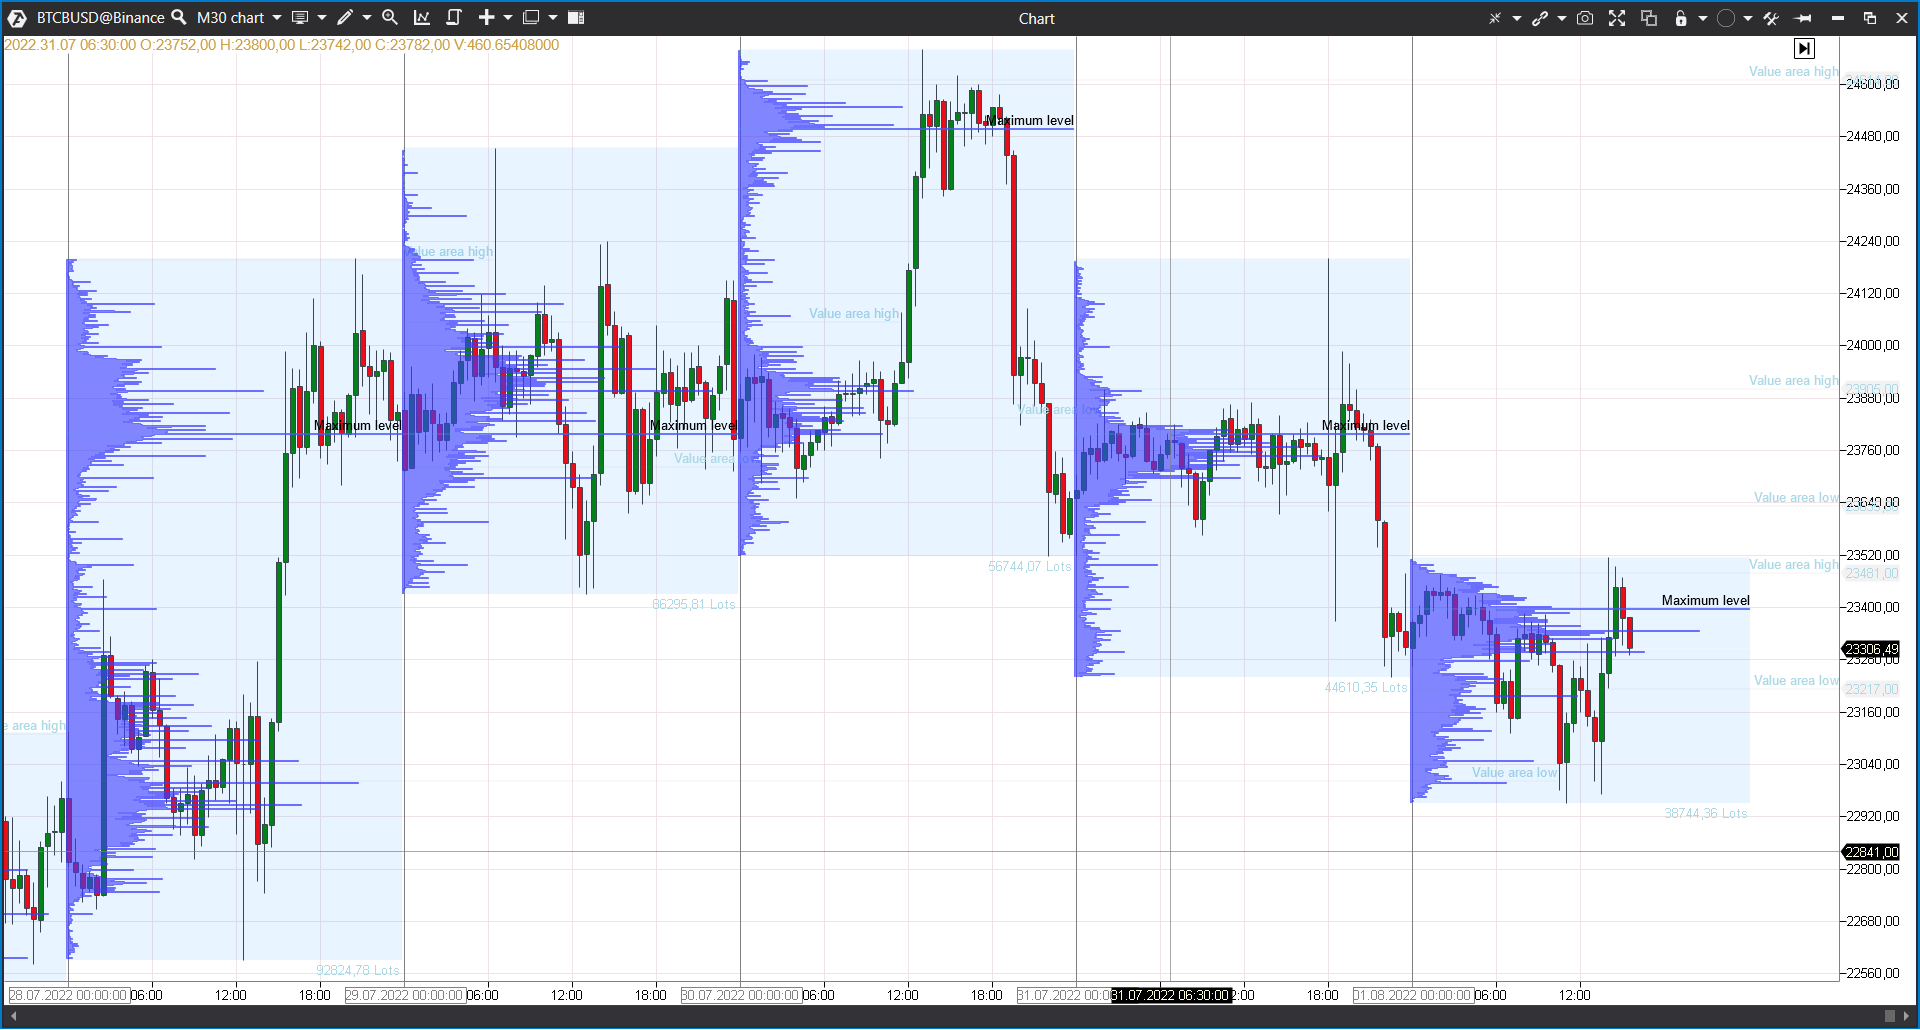
Ein Indikator, mit dem Sie periodische Marktprofile erstellen können. Enthält auch ein klassisches TPO-Profil und die Initial Balance.
Ansicht des Indikators auf dem Chart:
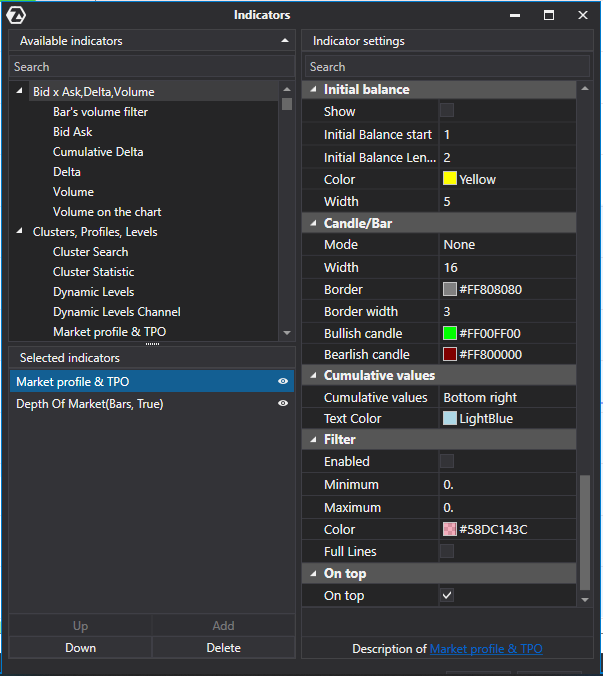
Um diesen Indikator hinzuzufügen und zu konfigurieren, öffnen Sie das Fenster Indikatoren Einstellungen.
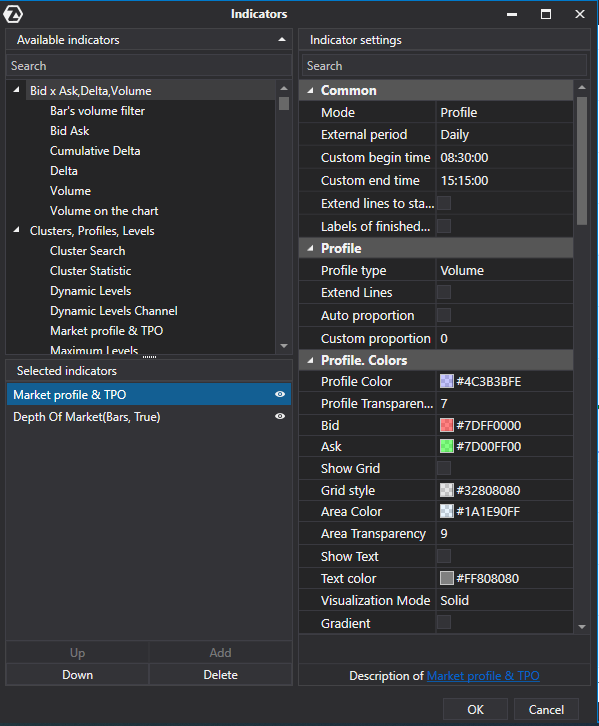
Common/Allgemeine
Mode/Modus - Anzeigemodus des Indikators auswählen.
- Profile/Profil
- TPO
- TPO and Profile/ТРО und Profil
- Profile over TPO/Profil über dem TPO
External period/Externe Periode - die Periode der Kalkulation des Indikators auswählen.
- M1/minütige
- M5/Fünfminütige
- M15/fünfzehnminütige
- M30/dreißigminütige
- Hourly/stündige
- H2/zweistündige
- H4/vierstündige
- H6/sechsstündige
- Daily/tägliche
- Weekly/wöchentliche
- Monthly/monatliche
- Custom/Benutzerdefinierte
Custom begin time/Anfangszeit - die Startzeit der Kalkulation manuell festlegen.
Custom end time/Endzeit - Die Endzeit der Kalkulation manuell festlegen.
Extend lines to start of next profile/Die Linien bis zum Anfang der Profile verlängern.
Lables of finished lines/Aufschriften an den fertigen Linien.
Profile/Profil
Profile type/Profiltyp - Auswahl des Typs der Profilkalkulationsdaten.
- Volume/Volumen
- Trades/Trades
- Delta/Delta
- Delta - colored/Delta (Farbe).
- Bid ask/Bids und Asks
Extend lines/Linien verlängern
Custom proportion/Manuelle Eingabe des Anteils - einen eigenen Anteilwert festlegen.
Auto proportion/Automatischer Anteil - Aktivierung/Deaktivierung des automatischen Anteils.
Profile colors/Profil.Farben
Profile color/Profilfarbe - Profilfarbe auswählen
Profile transparency/Profiltransparenz - Profiltransparenz festlegen.
Bid/Bids - Farbe der Bids auswählen.
Ask/Asks - Farbe der Asks auswählen.
Show grid/Raster anzeigen - Aktivierung/Deaktivierung der Rasteranzeige.
Grid color/Rasterfarbe - Auswahl der Rasterfarbe.
Area color/Hintergrundfarbe - Auswahl der Hintergrundfarbe.
Area transparency/Hintergrundtransparenz - Einstellung der Hintergrundtransparenz.
Show text/Text anzeigen - Aktivierung/Deaktivierung der Textanzeige.
Text color/Textfarbe - Auswahl der Textfarbe
Visualization mode/Anzeigemodus - Auswahl des Anzeigemodus.
- Bars/Bars
- Solid/Solide
- Border/Rahmen
Gradient/Farbverlauf - Ein/Ausschalten des Farbverlaufs.
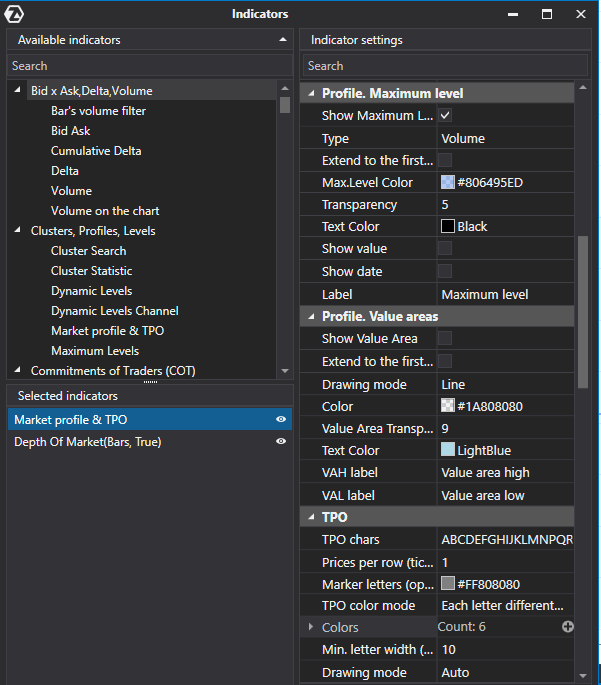
Profile maximum level/Profil. Maximale Stufe
Show maximum level text/Anzeigen - Ein/Ausschalten der Textanzeige der maximalen Stufe.
Type/Typ - Auswahl des Typs für die Kalkulation des Höchstwertes.
- Volume/Volumen
- Trades/Trades
- Delta/Delta
- Pozitive Delta/Positives Delta
- Negative Delta/Negatives Delta
- Bid/Bids
- Ask/Asks
Extend to the first touch/ Bis zu Berühren verlängern - Ein/ Ausschalten der Verlängerung bis zu Berühren.
Max. level color/Farbe der maximalen Stufe - Auswahl der Farbe der maximalen Stufe.
Transparency/Transparenz - Einstellung der maximalen Transparenzstufe.
Text color/Überschriftstext - Auswahl der Farbe des Textes der höchsten Stufe.
Show value/Wert anzeigen
Show date/Datum anzeigen
Label/Aufschrift
Profile value area settings/Profil. Value area
Show value area/Value Area anzeigen - Ein / Ausschalten der Anzeige der Value Area.
Extend to the first touch/bis zu Berühren erweitern - Ein/ Ausschalten der Erweiterung der Values Area bis zu Berühren.
Drawing mode/Zeichnungsmodus - Auswahl der value area für den Zeichnungsmodus.
- Lines/Linien
- Area/Area
- Lines and area/Linien und Area
Color/Farbe - Auswahl der Farbe für die value area.
Value area transparency/Value Area Transparenz - Einstellungen der Value Area Transparenz.
Text color/Textfarbe
VAH label/VAH Aufschrift
VAL label/VAL Aufschrift
TPO
TPO chars/ТРО Buchstaben - Auswahl der Reihenfolge der verwendeten Buchstaben.
Prices per row (ticks)/Preiskleber (in Ticks) - Kombination von Preisstufen.
Marker letters (open, close)/Markerbuchstaben (öffnend, schließend) - Farbauswahl der Schlüsselbuchstaben.
TPO color mode/ TPO-Farbmodus - Auswahl des TPO-Farbmodus.
- Each letter different color/Eine separate Farbe für jeden Buchstaben
- All letter same color/Eine Farbe
Colors/Farben - Auswahl der Buchstabenfarben.
Min. letter width (pixels)/Min. Buchstabenbreite (in Pixel) - Einstellung der minimalen Breite der Buchstaben.
Drawing mode/Zeichnungsmodus - Auswahl des Zeichnungsmodus.
- Auto/Auto
- Letters/Buchstaben
- Blocks/Blocks
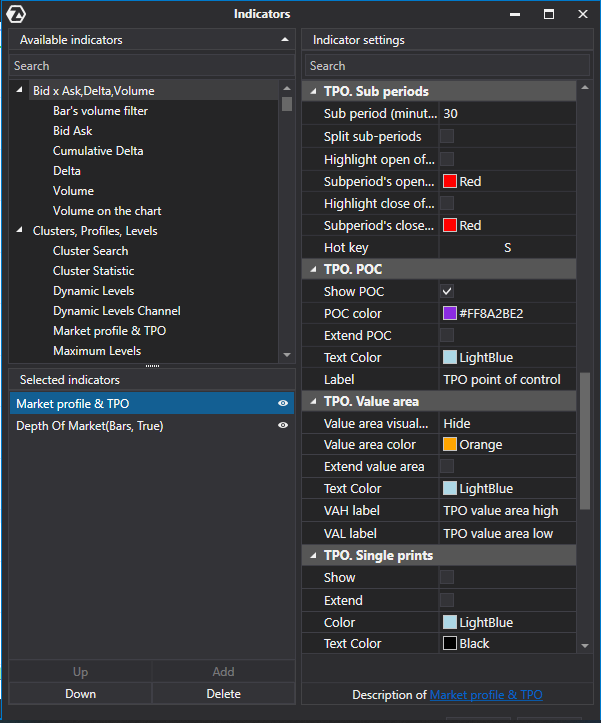
TPO. Sub period/ТРО. Teilperiode
Sub period (minutes)/Teilperiode (in Minuten) - Größe der Teilperiode angeben
Teilperioden teilen
Highlight open of each new sub period/Die Öffnung jeder Teilperiode hervorheben - Aktivieren/Deaktivieren der Zuteilung der einzelnen Teilperioden.
Subperiod's open color/Farbe der Öffnung der Teilperiode
Highlight close of each new sub period/Den Schluss jeder Teilperiode hervorheben
Subperiod's close color/Farbe des Schlusses der Teilperiode
Hotkey
TPO. POC settings/ТРО. Einstellungen РОС
Show POC/ РОС anzeigen - ein/ ausschalten der РОС- Anzeige.
POC color/ РОС Farbe - РОС Farbe auswählen.
Extend POC/РОС verlängern - Ein/Ausschalten der РОС Verlängerungng bis zum Berühren.
Text color/Textfarbe
Label/Aufschrift
TPO. Value area settings
Value area visual mode/value area Modus - value area Anzeigemodus auswählen
- Area/Area
- Lines/Linien
- Hide/Ausblenden
Value area color/ value area Farbe - Farbe der Area auswählen
Extend value area/value area verlängern- Ein/Ausschalten der Areaverlängerung
Text color/Textfarbe
VAH Aufschrift
VAL Aufschrift
TPO. Single prints/TPO. Einzelne Drucke
Show/Anzeigen - Anzeige der einzelnen Ausdrucke aktivieren.
Extend/Verlängern - die Linien bis zum nächsten Profil verlängern.
Color/Farbe - Linienfarbe.
Text color/Textfarbe
Intial balance
Show/Anzeigen - Ein/Ausschalten der Initial balance- Anzeige.
Initial Balance start/Start der Initial balance- Kalkulation.
Initial balance length (TPO)/Länge von initial balance (TPO) - die Länge der Initial balance in Teilperioden angeben.
Color/ Farbe - Auswahl der initial balance - Farbe.
Width/Breite - Breite der initial balance angeben.
Cumulative values/Kumulative Werte
Cumulative values/Kumulative Werte - Auswahl der Position für die Anzeige der kumulativen Werte.
- Top Left/ Oben links
- Top Right/ Oben rechts
- Bottom Left/ Unten links
- Bottom right/ Unten rechts
- Hide/Ausblenden
Text color/Textfarbe.
Filter
Enabled/Aktiviert - Ein/Ausschalten des Filters.
Minimum/Minimum - den minimalen Filterwert angeben.
Maximum/Maximum - den maximalen Filterwert angeben.
Color/Farbe - Farbe der Hervorhebung auswählen.
Full Lines/Hervorhebung erweitern - Ein/Ausschalten der Erweiterung der hervorgehobenen Stufe auf die Breite des gesamten Profilbereichs.
On top/Über dem Preis
On top/Über dem Preis - Ein/Ausschalten des Profilüberlagerungsmodus auf dem Chart.
War dieser Artikel hilfreich?
Das ist großartig!
Vielen Dank für das Feedback
Leider konnten wir nicht helfen
Vielen Dank für das Feedback
Feedback gesendet
Wir wissen Ihre Bemühungen zu schätzen und werden versuchen, den Artikel zu korrigieren